When the Stands Are Empty
Measuring Home Court Advantage During the COVID-19 Pandemic
Home court advantage (or home field advantage) is a well-documented phenomenon in sports in which the team playing on their home turf has a slight statistical edge over their opponent. There are many possible sources for this advantage, including:
- Familiarity with the court or field's intricacies (e.g., baseball field dimensions)
- Familiarity with the home environment (weather, altitude, etc.)
- Psychological effect of favorable fans on the players
- Psychological effect of fans on referees or umpires
- Physical toll of travel to away games
These factors likely all contribute to the advantage to varying degrees, but isolating the impact of each is a challenging task due to the many correlated variables involved. For example, one could try to measure the travel impact by looking at home court advantage as a function of the away team's travel distance, but travel distance is likely correlated with fan willingness to attend away games as well as the similarity of the climate at the two locations.
A natural experiment
During the 2020-21 and 2021-22 NCAA basketball seasons, most schools played in empty arenas or in arenas with very limited attendance due to COVID-19 restrictions. This provided a rare opportunity to study home court advantage in a controlled setting, where the primary change was the absence of fans and most other factors like travel and court familiarity remained constant. Most teams only played in-conference games, eliminating "money games" that often result in lopsided victories, but out-of-conference games can easily be removed from the analysis to avoid skew.
Measuring home court advantage
I quantify home court advantage by looking at the distribution of score differentials in a season (home team score minus away team score) and computing the mean: $$ \text{Home Court Advantage} = \frac{1}{N}\sum_{i}^N\left(\text{Home Score}_i - \text{Away Score}_i\right) $$ A historgram of the score differentials for all seasons combined from 2010-11 to 2022-23 is shown in black in the left-hand panel of the figure below. Gaussian kernel density estimates (KDEs) of the distributions for each season are shown in color. One obvious feature is the trough at 0, which we expect to see since a score differential of 0 indicates a tie, currently not possible under NCAA basketball rules. Interestingly, the density does not reach its local maxima immediately to the left and right of the trough, but rather at $+3$ and $-3$ points. This is likely an artifact of the end-game strategy teams often employ when trailing by a small number of points, which is to foul the winning team to stop the clock and try to get the ball back. This generally doesn't work and instead the winning team scores more points, furthering their lead.
Aside from the trough feature, there is a visual skew towards positive score differentials, indicating a higher proportion of games won by the home team. The right-hand panel shows a zoomed-in view with vertical dashed lines and errorbars indicating the mean and standard error for each season. The average for the non-COVID seasons is $3.31 \pm 0.84$ points, and if we remove the 2016-17 season, which has a notably lower home court advantage, that goes up to $3.35 \pm 0.80$ points. During the two pandemic-affected seasons, the average home court advantage dropped to $2.50 \pm 0.78$ points, a $0.85 \pm 1.11$ point decrease.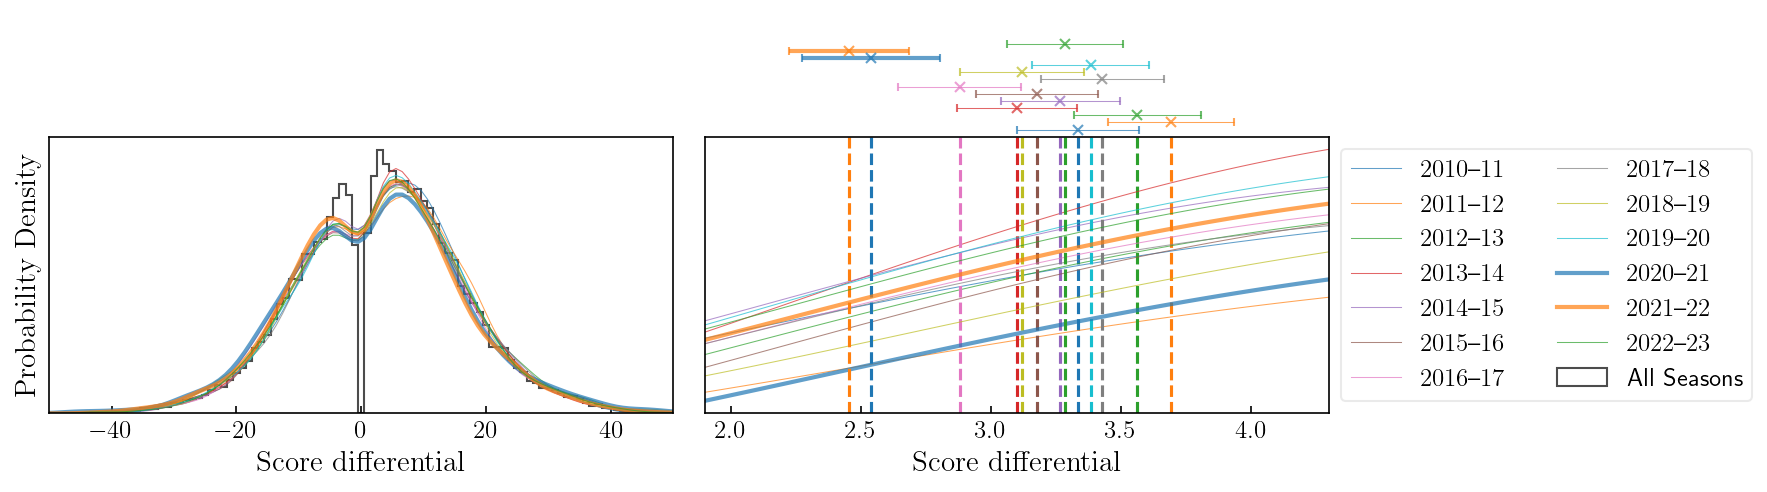
| Year | Advantage | Year | Advantage | Year | Advantage | Year | Advantage | Year | Advantage |
|---|---|---|---|---|---|---|---|---|---|
| 1984–85 | $3.86 \pm 0.26$ | 1992–93 | $4.12 \pm 0.27$ | 2000–01 | $4.34 \pm 0.25$ | 2008–09 | $3.42 \pm 0.24$ | 2016–17 | $2.88 \pm 0.24$ |
| 1985–86 | $3.90 \pm 0.26$ | 1993–94 | $3.98 \pm 0.27$ | 2001–02 | $4.29 \pm 0.25$ | 2009–10 | $3.45 \pm 0.23$ | 2017–18 | $3.43 \pm 0.24$ |
| 1986–87 | $3.92 \pm 0.28$ | 1994–95 | $3.64 \pm 0.27$ | 2002–03 | $4.02 \pm 0.25$ | 2010–11 | $3.33 \pm 0.23$ | 2018–19 | $3.12 \pm 0.24$ |
| 1987–88 | $4.63 \pm 0.28$ | 1995–96 | $3.67 \pm 0.27$ | 2003–04 | $3.87 \pm 0.25$ | 2011–12 | $3.69 \pm 0.24$ | 2019–20 | $3.38 \pm 0.22$ |
| 1988–89 | $4.27 \pm 0.29$ | 1996–97 | $4.36 \pm 0.26$ | 2004–05 | $3.77 \pm 0.24$ | 2012–13 | $3.56 \pm 0.24$ | 2020–21 | $2.54 \pm 0.26$ |
| 1989–90 | $4.42 \pm 0.28$ | 1997–98 | $3.93 \pm 0.28$ | 2005–06 | $3.59 \pm 0.24$ | 2013–14 | $3.10 \pm 0.23$ | 2021–22 | $2.45 \pm 0.23$ |
| 1990–91 | $4.04 \pm 0.29$ | 1998–99 | $4.13 \pm 0.27$ | 2006–07 | $3.83 \pm 0.24$ | 2014–15 | $3.27 \pm 0.23$ | 2022–23 | $3.28 \pm 0.22$ |
| 1991–92 | $4.24 \pm 0.29$ | 1999–00 | $4.10 \pm 0.27$ | 2007–08 | $4.00 \pm 0.24$ | 2015–16 | $3.18 \pm 0.23$ |
Statistical significance
To quantify the significance of the home court advantage decrease, I performed a series of Welch's $t$-tests and two-sample Kolmogorov-Smirnov (KS) tests on the score differential distributions. The Welch's $t$-test is a statistical test used to test the null hypothesis that the means of two distributions are equal, while the KS test is used to test the null hypothesis that the two distributions are drawn from the same underlying distribution. I performed the test on all unique combinations of seasons from 2009-10 to 2022-23. The $p$-values for all pairs for each test are shown below. Low values (<0.05) indicate statistical significance and are traced with a dotted border.
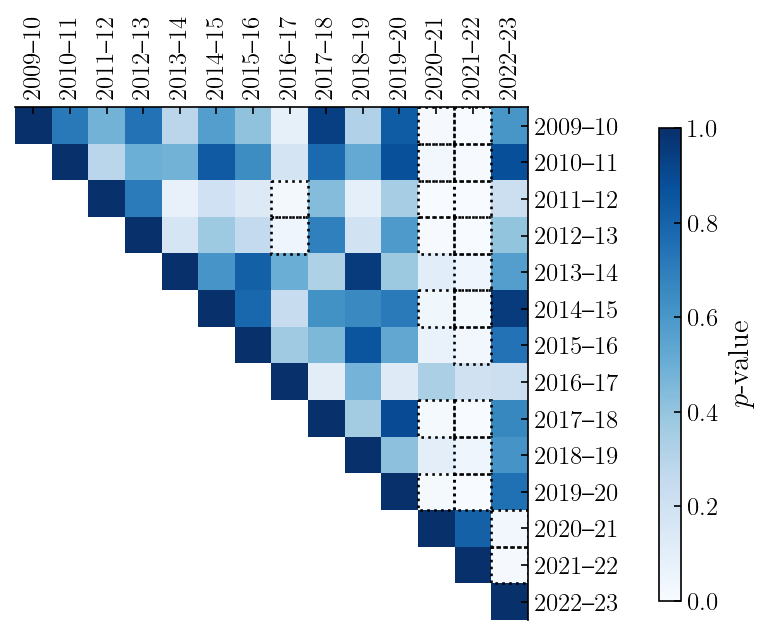
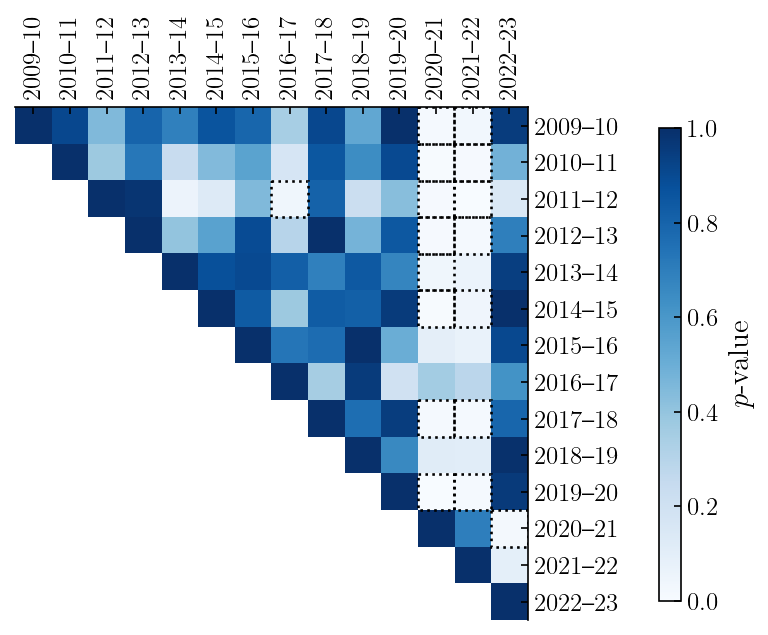
The table below lists out the $p$-values for the comparisons involving the two pandemic-affected seasons (2020-21 and 2021-22) against all other seasons. Comparisons in which the $p$-value is less than 0.05 are highlighted in yellow, indicating statistical significance. Other than the COVID-to-COVID season comparisons, which we would expect to have high $p$-values (equal to 1.0 by definition for like-season comparison), the majority of the comparisons show statistically significant differences in home court advantage with the notable exception of the 2016-17 season. As far as I am aware, there were no major rule changes (e.g. instant replay), conference realignments, or other factors that would explain the lower advantage in that season.
| Year | Welch's $t$-test $p$-value | KS test $p$-value | ||
|---|---|---|---|---|
| 2020-21 | 2021-22 | 2020-21 | 2021-22 | |
| 2009-10 | 0.009 | 0.002 | 0.012 | 0.029 |
| 2010-11 | 0.024 | 0.007 | 0.004 | 0.012 |
| 2011-12 | 0.001 | 0.000 | 0.012 | 0.001 |
| 2012-13 | 0.004 | 0.001 | 0.011 | 0.013 |
| 2013-14 | 0.106 | 0.047 | 0.037 | 0.060 |
| 2014-15 | 0.036 | 0.012 | 0.006 | 0.041 |
| 2015-16 | 0.069 | 0.027 | 0.095 | 0.068 |
| 2016-17 | 0.334 | 0.196 | 0.359 | 0.282 |
| 2017-18 | 0.012 | 0.003 | 0.013 | 0.014 |
| 2018-19 | 0.100 | 0.044 | 0.114 | 0.108 |
| 2019-20 | 0.014 | 0.004 | 0.002 | 0.015 |
| 2020-21 | 1.000 | 0.810 | 1.000 | 0.698 |
| 2021-22 | 0.810 | 1.000 | 0.698 | 1.000 |
| 2022-23 | 0.030 | 0.010 | 0.022 | 0.090 |
Change over time and conference comparisons
It's also interesting to explore how home court advantage has changed over time and how it varies from conference to conference. The figure below shows the 5-year moving average of home court advantage for major conferences and groups of converences, plus the Ivy League. As one might expect given their lower attendance and fan engagement, the Ivy League has the lowest home court advantage. An interesting trend is the overall decrease in advantage, especially for Power 5 and Group of 5 conferences, beginning in the early 2000s. This predates major conference realignments, so other factors (like instant replay) may be at play. One possibility is that with increases in athletic department spending, the players are better accommodated and less fatigued from travel.
Impact on game outcomes
While a decrease in home court advantage of 0.85 points may seem small, it is not insignificant. Since 2010, 4.8% of games have been decided by only 1 point, 6.4% by 2 points, and 6.8% by 3 points. That's 18.1% of games that were decided by 3 points or fewer (and remember, many 2- and 3- point wins were likely 1-point games until the intentional foul shenanigans in the final minute of the game). This means that a 0.85 point decrease in home court advantage could potentially change the outcome of around 1 in every 20 games. From 2009-10 to 2019-20, home teams won 60.6% of games; in 2020-21 and 2021-22, that dropped to 57.7% and 57.9%, translating to 80 and 87 more away wins, respectively.
These measurements highlight the importance of a strong fan base. While factors like court familiarity and travel remain, the primary change during the pandemic was the absence of fans. It's unclear from this analysis whether the fans have a greater impact on actual player performance or referee behavior. Leitner and Richlan (2021) examined the 2019-20 COVID seasons in elite European soccer leagues and found that in the absence of fans, home teams received significantly more yellow cards than in previous seasons, suggesting fans are capable of influencing referees' decisions. Further study of foul rates at home and away games could help disentangle these effects in the NCAA data.