Is Domino's Ruining My Sleep?
Measuring the impact of fast food on my sleep metrics
I love Domino's. It's my go-to fast food when I'm feeling lazy. You just can't beat their two medium 2-topping pizzas for $7.99 deal. However, I don't think my body's as enthusiastic about it as I am. Every night I have it, I wake up in the middle of the night PARCHED and fumble around half asleep looking for my water bottle. By morning, I'm usually groggy and have a faint headache. Still worth it.
It recently occurred to me that I have an email receipt from every order, and I've worn a Garmin watch nearly every night since December 2015, so I can actually quantitatively measure how the pizza's impacting my sleep. I'm generally cautious about over-interpreting sleep metrics from consumer wearables—there's evidence that simply telling someone they had a bad night's sleep can reduce their alert cognition and increase their fatigue whether they truly slept poorly or not. However, I do think they can be useful for measuring long-term trends and the overall impact of different factors on sleep quality. At the very least, it's a fun exercise to see if what I've experienced anecdotally is reflected in my data.
The Data
While I've worn different Garmins since 2015, I upgraded to my current watch, the Fenix 7, in November 2022. The Fenix includes a REM sleep time measurement that the previous watch didn't have, and it also computes an overall "Sleep Score." To keep the analysis consistent, I'll only use data coming from the Fenix. Additionally, in case there's any "calibration time" for the new watch, I'll cut off the first few weeks of data and only use January 1, 2023 onward. In this time period, I had Domino's on 27 nights. I also downloaded all of my DoorDash order history in case there are any other restaurants I could look at. I ordered Main Chick Hot Chicken (a Nashville hot chicken restaurant) 24 times, so I'll include it in the analysis, but I'll exclude any others since my next most frequented restaurant had only 6 orders.
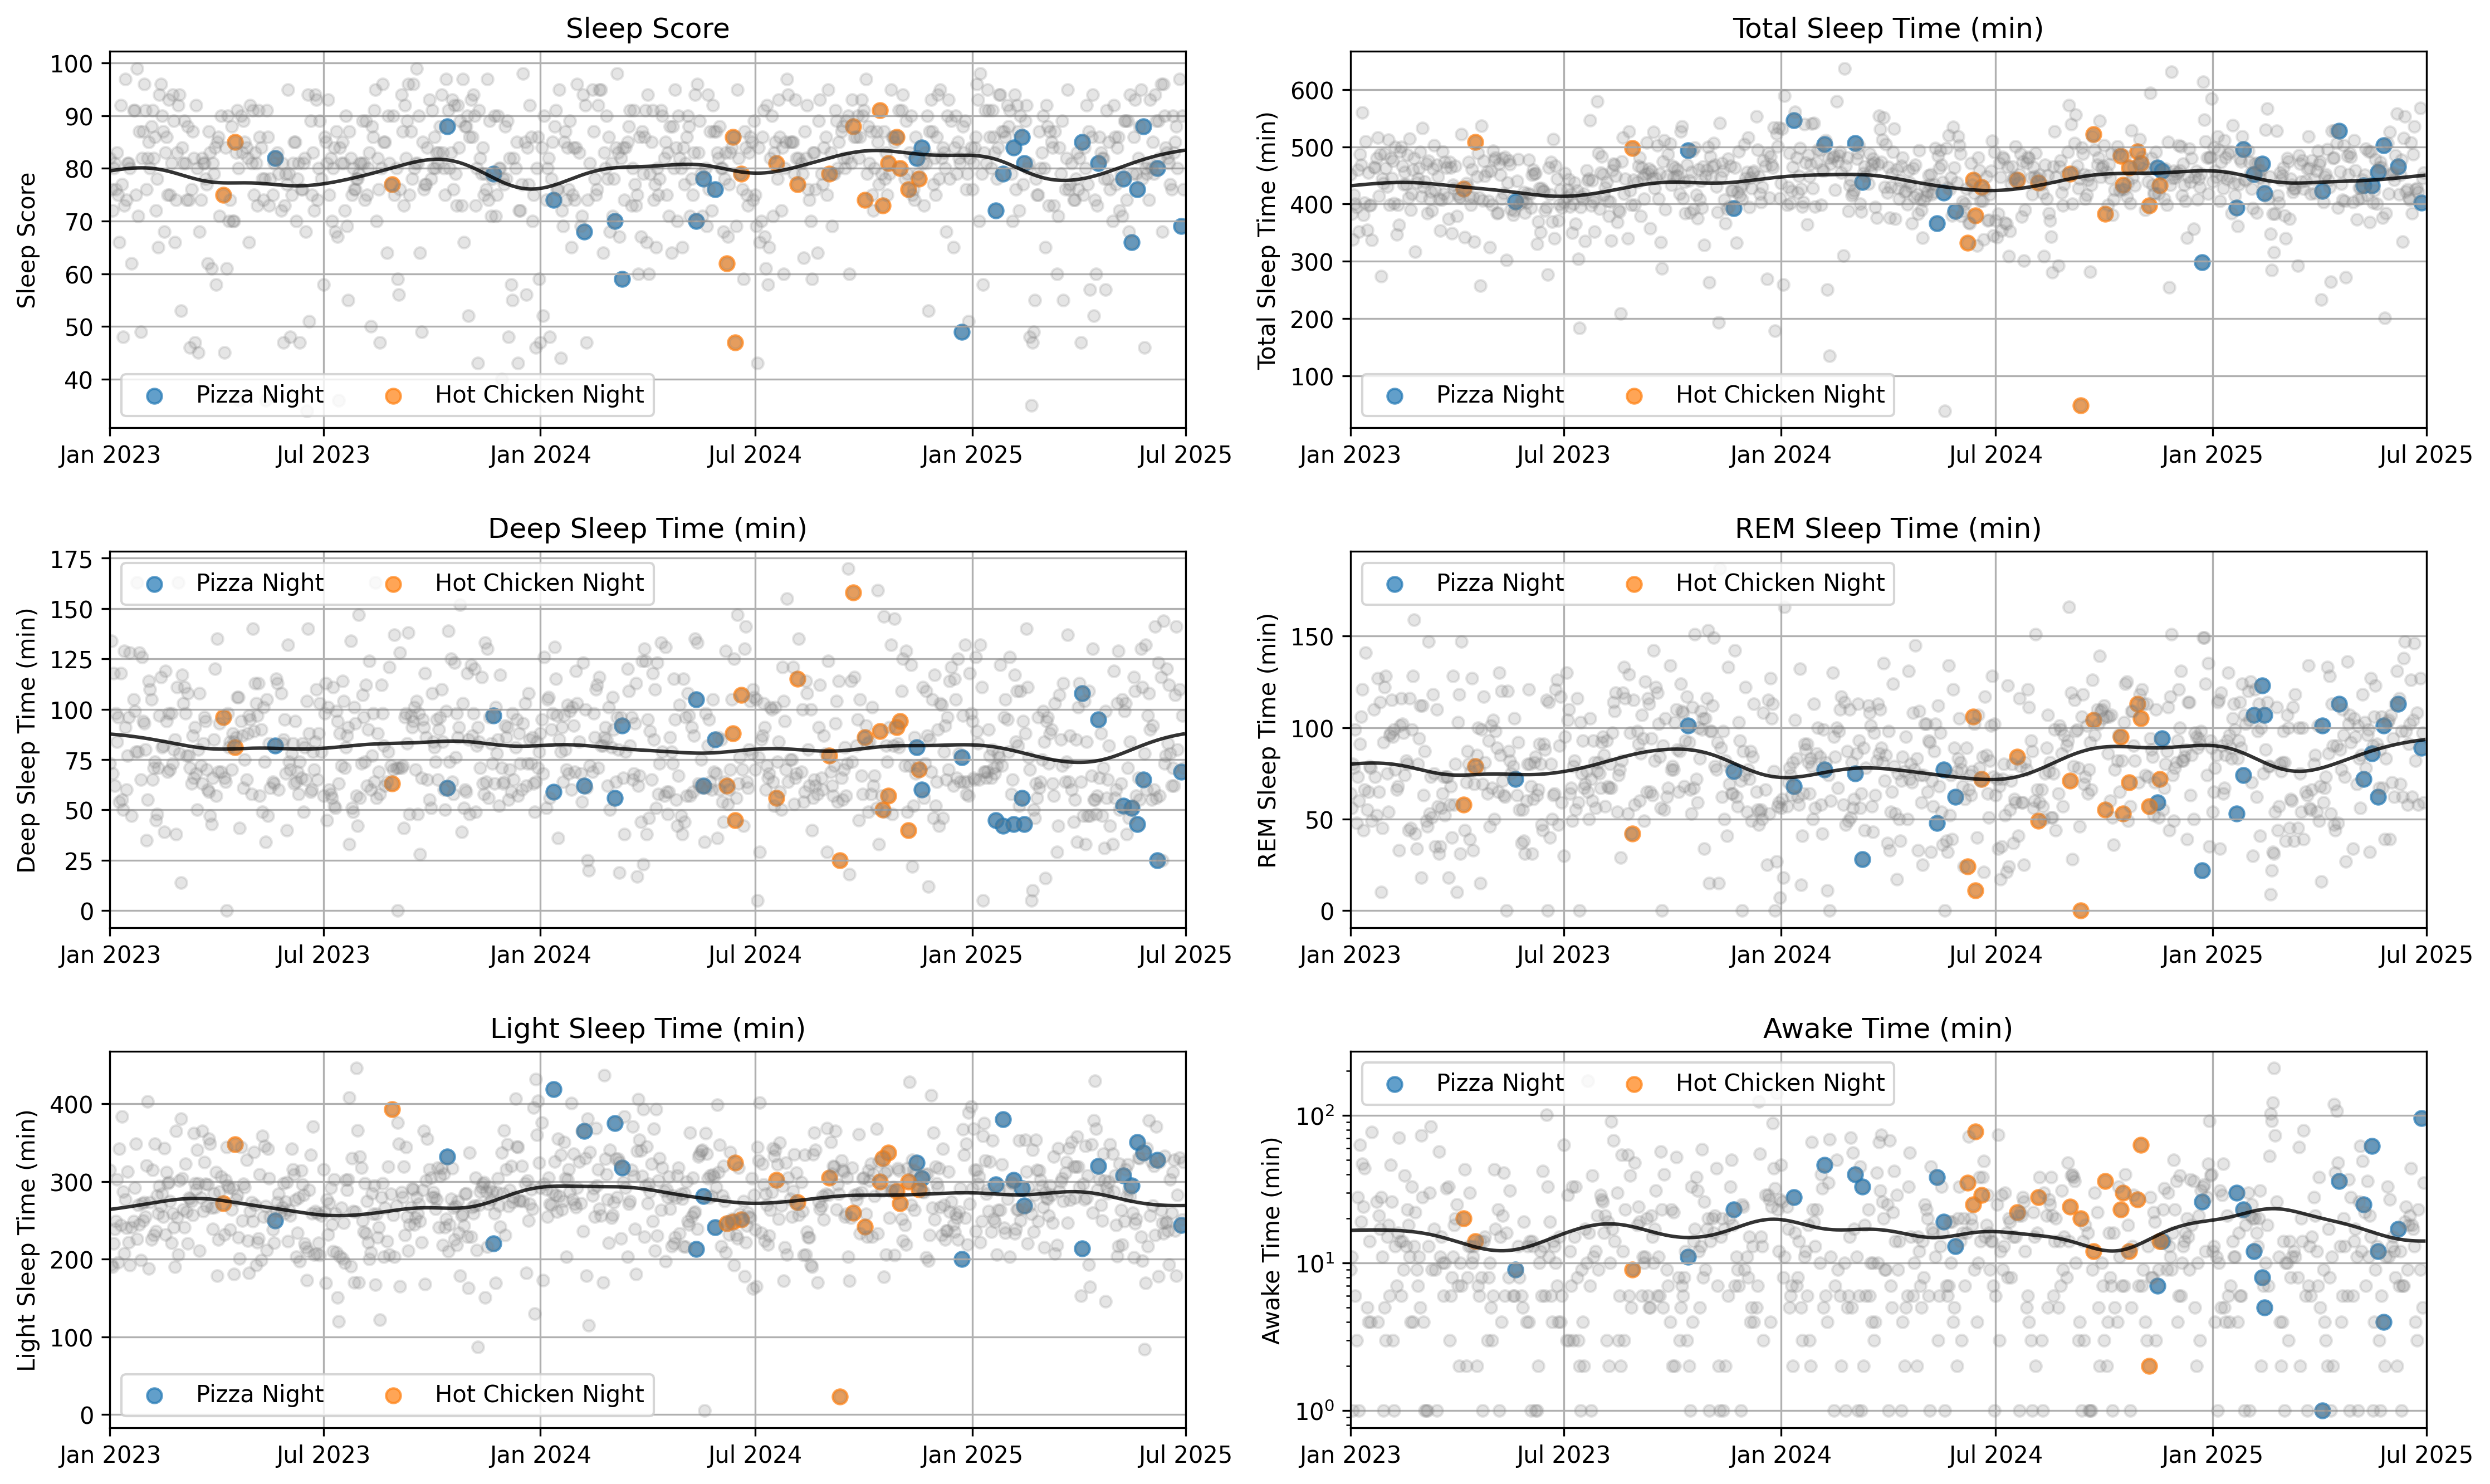
The metrics my watch provides are Total Sleep Time, Deep Sleep Time, REM Sleep Time, Light Sleep Time, Awake Time, and a Sleep Score. The Sleep Score is a score from 0 to 100 that, according to the Garmin website, is calculated based on sleep duration, heart rate, heart rate variability (HRV), and times of and transitions between the different sleep stages[ref]. Unfortunately, there's little more information on how the each metric is measured and how exactly they go into the Sleep Score calculation, so we'll need to take each at face value. The plots below show the raw data for each metric, along with a Gaussian filter moving average to show overall trends. The standard deviation of the filter, 28 days, was chosen by eye to balance fitting longer-scale trends while smoothing over shorter-term fluctuations.

De-Trending and Normalizing
All six metrics are relatively stable over time, although there are some minor long-term trends. For example, Total Sleep Time shows a hint of seasonality with longer sleep times in the winter months and shorter sleep times in the summer. If I don't remove these trends, they could bias the results of the analysis. Take, for instance, my hot chicken phase of the summer of 2024. If I'm not careful, I might attribute shorter sleep times to Main Chick when in reality I just sleep less in the summer. What really matters is how I sleep on nights I eat Main Chick in the summer compared to similar nights in the same summer. I can account for this by "de-trending" the data and subtracting off the long-term trends (the Gaussian moving average lines from the plots above).
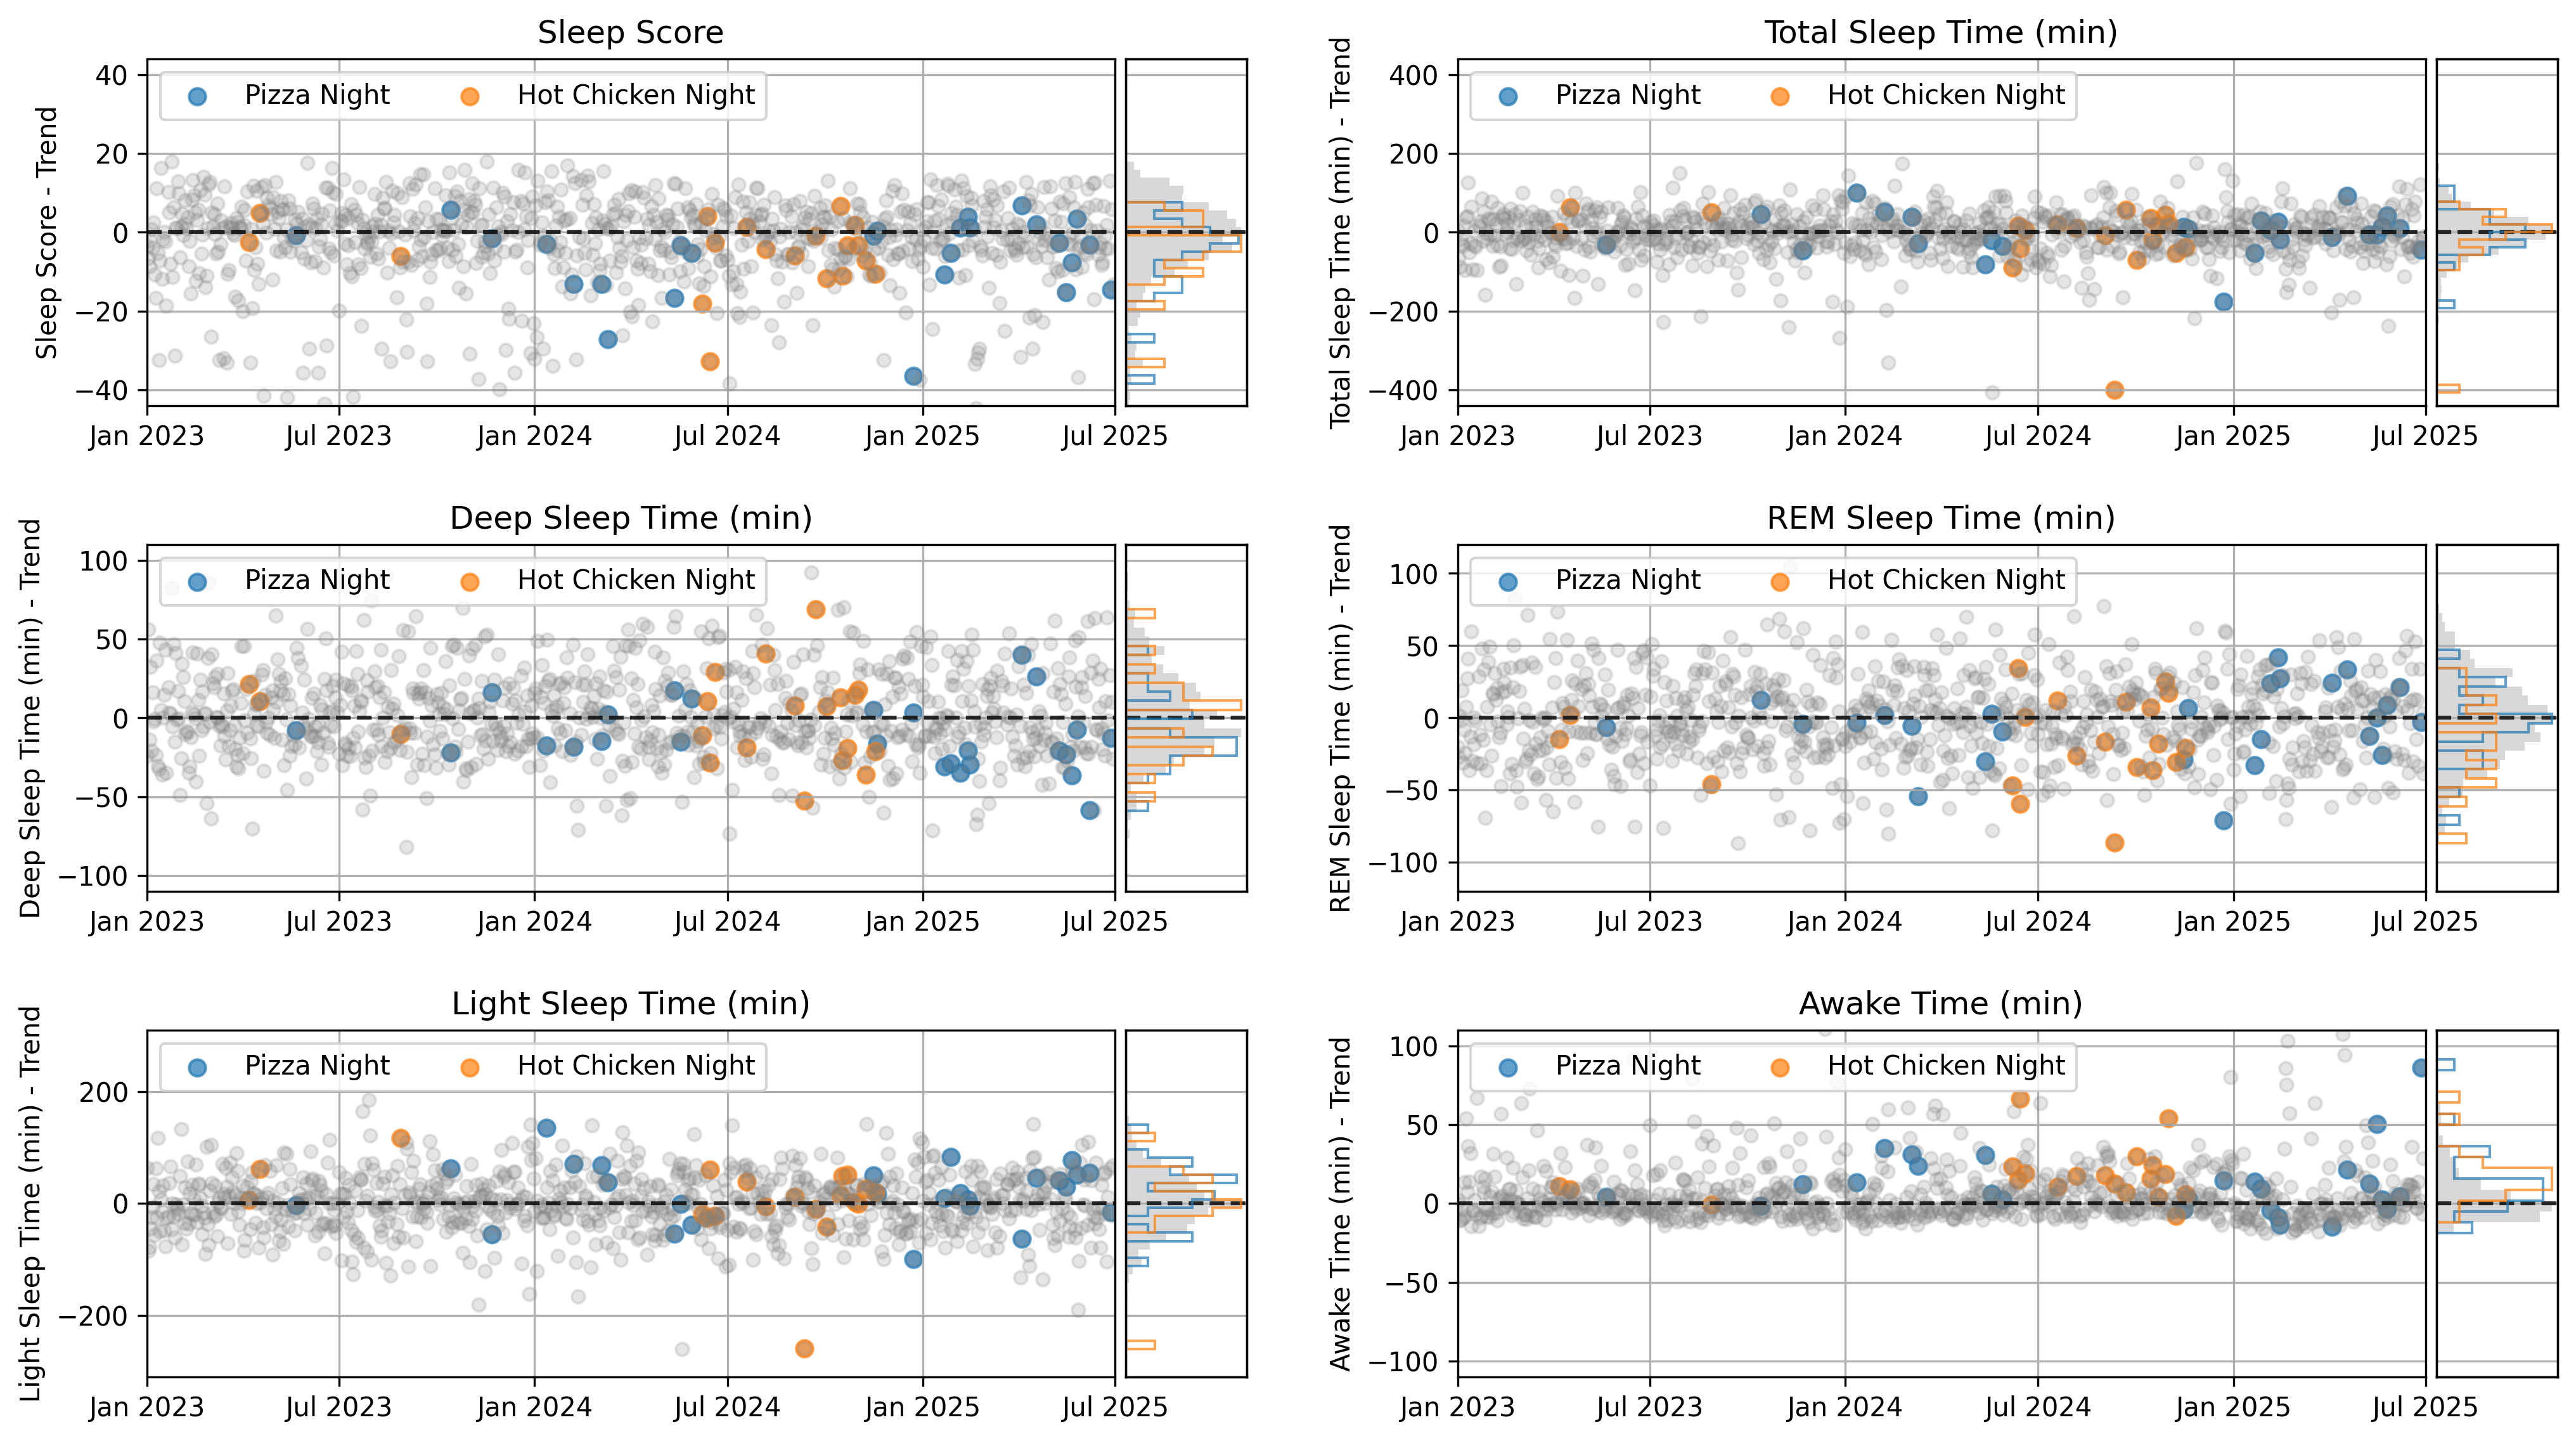
Another factor that might bias the results is the day of the week since I generally sleep longer on weekends. To correct for this, I can perform a similar de-trending process but this time subtracting off the average metric values for each day of the week. More specifically, I compute the median values of the de-trended metrics for each day of the week and subtract those values from the de-trended data. With the two corrections applied, the data now represent deviations of individual nights' metrics above or below the average trend, while accounting for day-of-week differences. The normalized data are shown in the figure below.

Measuring the Differences
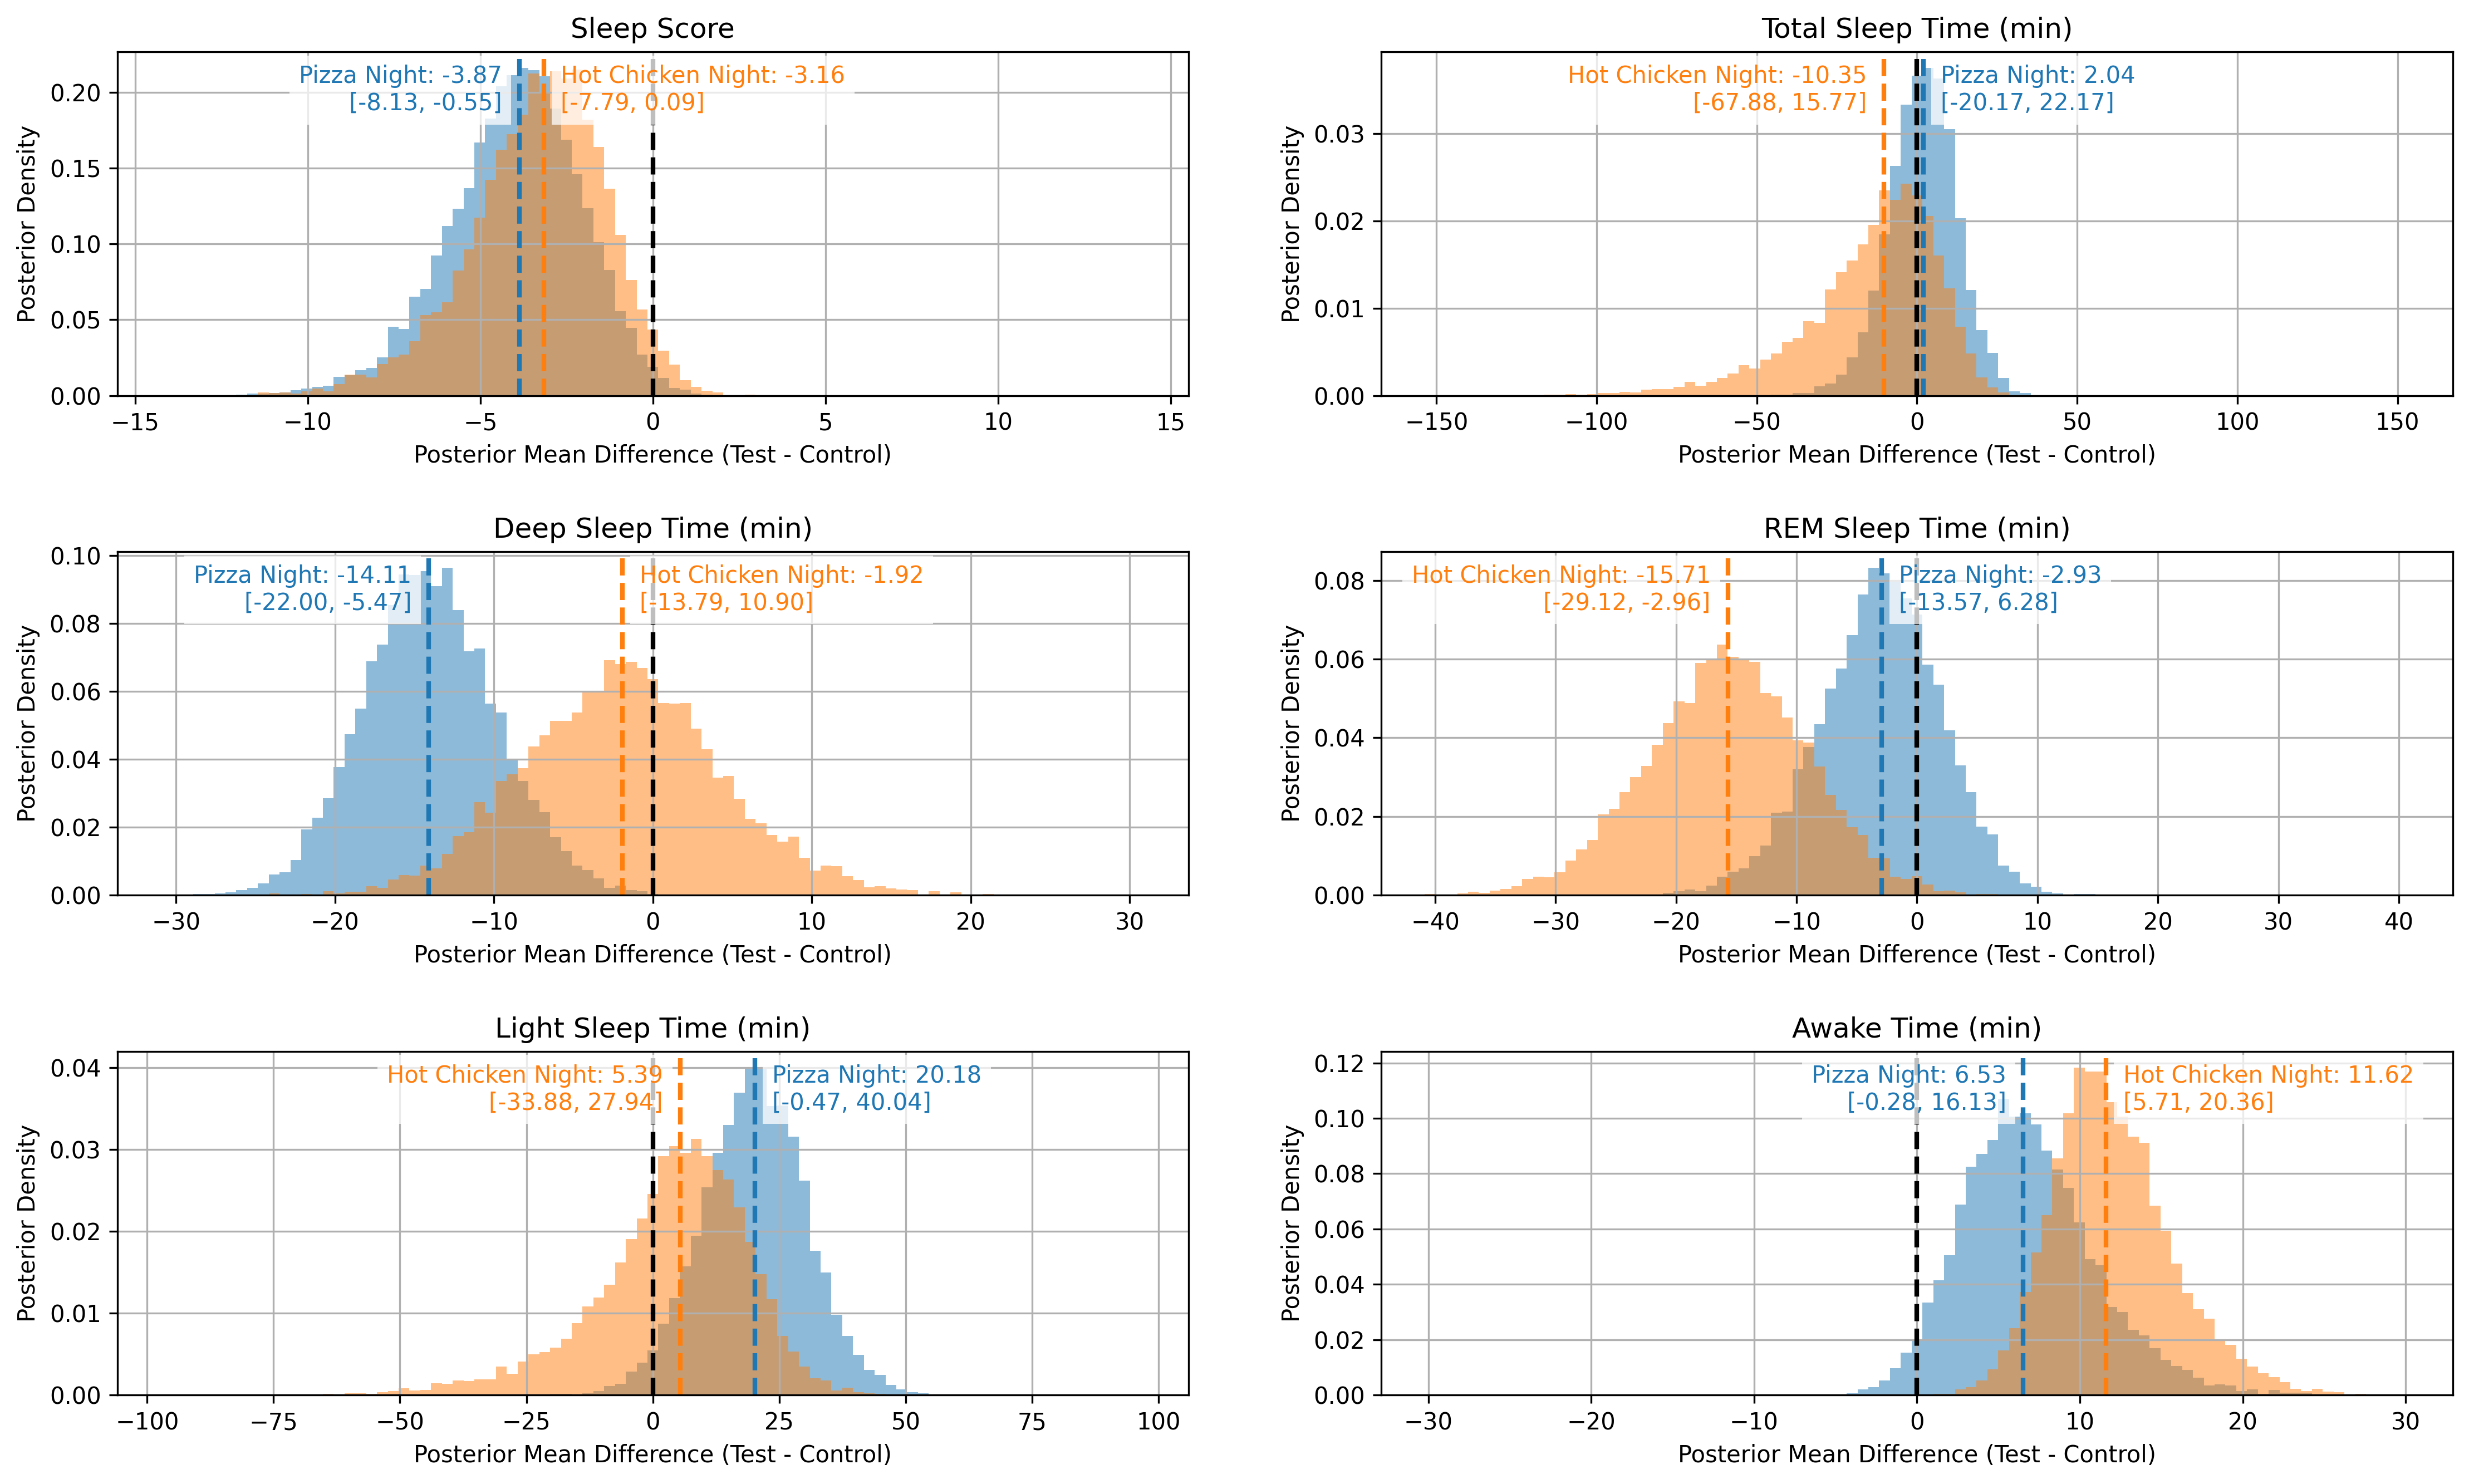
With the data cleaned up and normalized, I can now make comparisons between the "test" nights (nights I had Domino's or Main Chick) and the "control" nights (all other nights). With the small sample size of test nights and given some of the distributions are not normally distributed, I need to be cautious of using traditional parametric tests (such as $t$-tests) that assume normality and are also susceptible to outliers and noise. Instead, I'll use the Bayesian bootstrapping method, which is a resampling technique for estimating summary statistics like means. The approach involves repeatedly sampling the data with random weights assigned to each data point and computing the weighted mean for each sample. I can then use these construct posterior distributions for the differences in metric means between the test and control nights. A particular advantage of this approach is that it allows us to visualize the full posterior distributions, rather than reducing the results down to single point estimates. These posteriors are shown below, with the median and 95% credible intervals labeled.

From the posteriors, we can see that Domino's and Main Chick do have a statistically significant impact on some of my sleep metrics. On nights when I eat Domino's, I have $14.1^{+8.6}_{-7.9}$ (95% CI) fewer minutes of deep sleep, $20^{+20}_{-21}$ more minutes of light sleep, and $6.5^{+9.6}_{-6.8}$ more minutes of awake time (about the time it takes for me to find and re-fill my water bottle!). On nights when I eat Main Chick, I have $16^{+13}_{-13}$ fewer minutes of REM sleep and $11.6^{+8.7}_{-5.9}$ more minutes of awake time. My Sleep Score drops by $3.9^{+3.3}_{-4.3}$ and $3.2^{+3.3}_{-4.6}$ points on nights I have Domino's and Main Chick, respectively. My total sleep time is remains consistent, suggesting I'm trading "good" sleep for "bad" sleep rather than losing sleep all together.
| Metric | Pizza Night | Hot Chicken |
|---|---|---|
| Sleep Score | $-3.9^{+3.3}_{-4.3}$ | $-3.2^{+3.3}_{-4.6}$ |
| Total Sleep Time (minutes) | $+2^{+20}_{-22}$ | $-10^{+26}_{-60}$ |
| Deep Sleep Time (minutes) | $-14.1^{+8.6}_{-7.9}$ | $-2^{+13}_{-12}$ |
| REM Sleep Time (minutes) | $-2.9^{+9.2}_{-10.6}$ | $-16^{+13}_{-13}$ |
| Light Sleep Time (minutes) | $+20^{+20}_{-21}$ | $+5^{+23}_{-39}$ |
| Awake Time (minutes) | $+6.5^{+9.6}_{-6.8}$ | $+11.6^{+8.7}_{-5.9}$ |
Takeaways
So what does this all mean? Should I stop eating Domino's and Main Chick? Probably, for a lot of reasons. Will I? Absolutely not. I'll try to remember to fill my water bottle before going to bed, but first I have a medium pepperoni and onion pizza, stuffed cheesy bread, and a side of garlic dipping sauce to pick up.